


Try GitClear for 15 days free
without a credit card

Gallery of free git stats tools with screenshots & examples

All the modern problems are born of abundance rather than scarcity, so said Naval Ravikant when waxing about our generation's unprecedented access to social media affirmation, distraction, and calorie-rich foods.
As it turns out, the modern oversupply of "too much good stuff" stretches down into the domain of the esoteric developer tools as well. The wealth of readily available git stats is unprecedented. But, as the adage goes, you get what you pay for, and shall we say, all of the git stats projects one finds on GitHub are very free. The purpose of this guide is to help separate wheat from chaff by giving examples and screenshots of the most popular git stats available in 2026.
When it comes to sourcing git stats, you have four good options to consider. We will order them by the amount of effort to get started, beginning with the easiest.
First question: What do you hope to do with the stats?
Choosing the best source from the free git stats options below starts by asking "How do I want to use these stats?" The four git stat sources vary by setup time and features, but a constant between them is that they are sourced from "commits" and "lines of code," which are dangerous sources of truth to rely upon if you're hoping to gauge progress or make predictions. ☠️
Lines of Code: As is illustrated in this Lines of Code Breakdown, only about 5% of lines of code correspond to meaningful developer work. There's a reason that conventional wisdom is so down on using lines of code. You definitely wouldn't want so much noise in a "progress" metric.
Commit Count: Suffers from its own set of problems, the most grave of those being that it is trivial to game. Caustic team dynamics inevitably ensue when developers see it treated by management as an indicator of progress, because it incentivizes developers to pollute the repo with contrived commits. Commit Count is not totally devoid of value though. It can offer broadstroke granularity as a statistical tool when used to look at long time horizons. Measures like "median commit count" tend to converge, based on our most recent statistical analysis.
If you are looking to get a stable measure of how briskly your repo contents are evolving, Diff Delta is the only git metric purpose-designed for the task. It has been empirically shown to more closely approximate "Developer Effort" then "Lines of Code" or "Commit Count." Like all the metrics on this page, Diff Delta is permanently free for use on the Starter plan. 🤑
1. Roll your own stats with git's command line options
The absolute simplest way to get git stats is to use the stats that are already built in to git [1]. Here are the most popular among those.
Commits per developer during past year
git shortlog -sn --no-merges --since "01 January 2019"
Returns in Tensorflow repo:
21255 A. Unique TensorFlower
1127 Yong Tang
1082 Derek Murray
991 Gunhan Gulsoy
865 River Riddle
839 Benoit Steiner
... [hundreds more rows]
Lines of code changed for a developer
git log --shortstat --no-merges --author="Author Name" | grep -E "fil(e|es) changed" | awk '{files+=$1; inserted+=$4; deleted+=$6; delta+=$4-$6; ratio=deleted/inserted} END {printf "Commit stats:
- Files changed (total).. %s\n- Lines added (total).... %s\n- Lines deleted (total).. %s\n- Total lines (delta).... %s\n- Add./Del. ratio (1:n).. 1 : %s\n", files, inserted, deleted, delta, ratio }' -
Returns in Tensorflow repo (for "Author Name" = "Yong Tang"):
Commit stats:
- Files changed (total).. 1856
- Lines added (total).... 28129
- Lines deleted (total).. 7038
- Total lines (delta).... 21091
- Add./Del. ratio (1:n).. 1 : 0.250204
There exist a variety of git command line stats at this gist. It's not going to be mistaken for the most robust visualization of what is happening in your repo, but the ease of access can't be beat.
2. Use your git provider or IDE stats
If you're using a source control host like GitHub, GitLab, or Bitbucket, you already have git stats at your fingertips. The good news about these stats is that they are free and available. The bad news is these metrics are provided based on ease of calculation, not "utility" or "applicability." For reasons described in Four Worst Metrics to Aggravate Developers, using "Commits" or "Lines of Code" to make or justify decisions tends to draw (warranted) ire from the dev team.
Still, if it's fast access to stats you want, it's fast access you will get by leveraging your existing source code host.
3. Start a free GitClear trial
For those who want to use their git stats to make business decisions, GitClear is the smart choice. Our metrics are vetted by hundreds of customers and the largest open source repos in the world. GitClear has built its reputation on providing signal-rich metrics that help teams squeeze 15%+ improvement to team velocity.
On average, GitClear is less effort to set up than the free tools that will be listed below. You log in through your git provider, and you will have reviewable data within 24 hours. While GitClear is not free after the trial period (averaging about $9/developer, much more affordable than any similar product), so you have little to lose by taking a peek at git stats that are not polluted by 95% noise.
4. Install a free git stats tool
There are no shortage of choices when it comes to the best free tools for measuring commits and lines of code. We will make three recommendations based on your goals.
Best option for rich features: Hercules
Hercules has reports. Rich, deep, esoteric... and sometimes even useful. Then there are reports like this... where it's anybody's guess what is supposed to be gleaned.
The latter chart also suggests a drawback of Hercules: dependencies (e.g., Tensorflow) and processing time. There is some heavy duty data processing necessary to create these reports, and the author has documented that these reports can strain under the weight of large development teams.
Installation of Hercules is... complicated. You've got to be thirsty for it.
Google's choice: IonicaBizau/git-stats
5,300 stars on GitHub. Last commit in 2020. Written in Javascript.
This tool earns two of the top three spots in Google as of April 2020, presumably for its combination of being installable via npm, and rich enough to show some (text-only) stats that mimic GitHub.
The downsides of this option: it only processes commits (not LoC); can't easily parameterize stats to view a particular range; hasn't been actively developed for the past five years; almost all functionality (including the screenshot shown above) requires installing additional npm packages. The default package shows only a rough calendar of commit activity over the past year.
Install and use:
npm i -g git-stats
git-stats -g -s '1 January 2020'
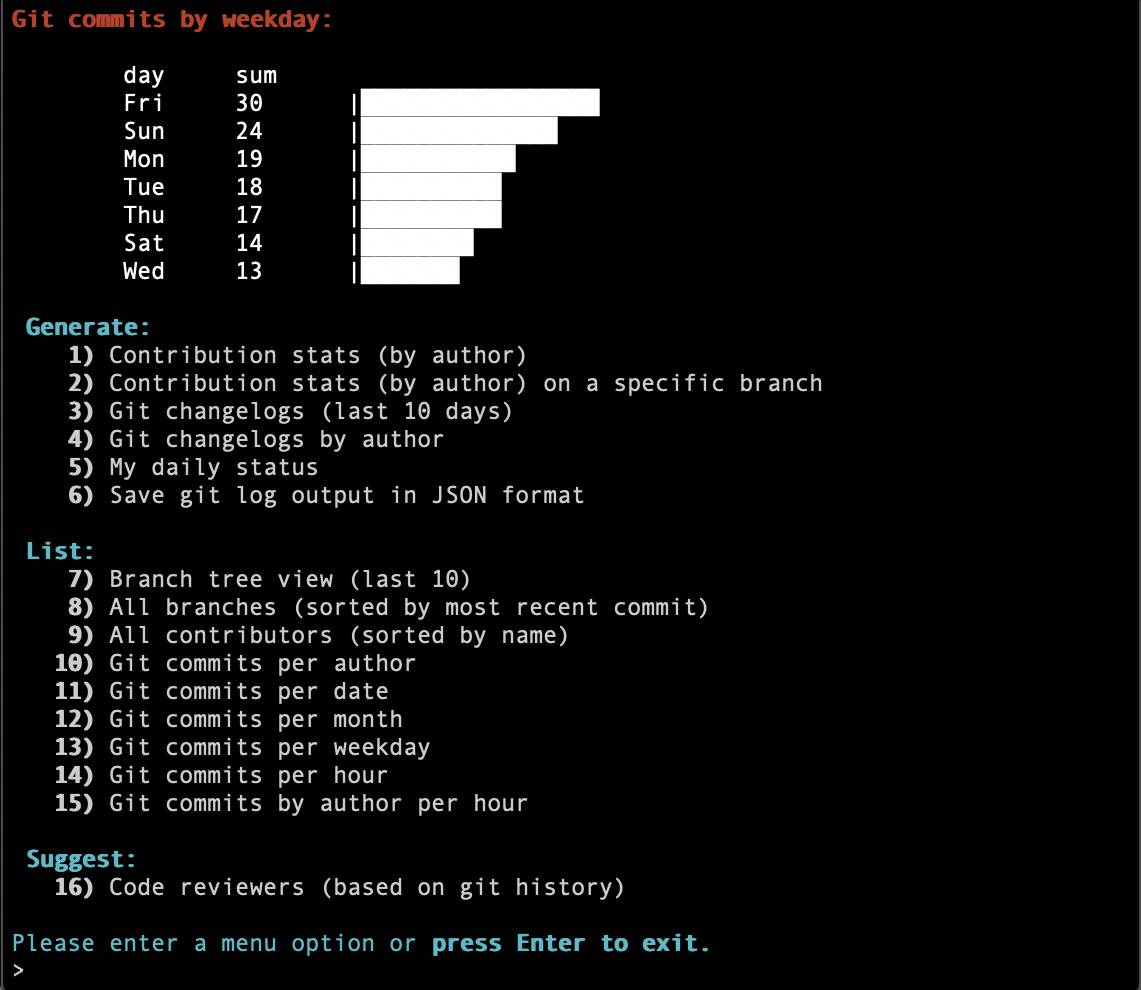
GitHub's second favorite: git-quick-stats
3,800 stars on GitHub. Last commit in 2020. Written in bash.
git-quick-stats is one of the few git tools that provides an interactive mode, which expedites the muddling that is typically required to get the free tools to output data over the desired time range and committer context.
Install & try out:
bash <(curl -s https://git-quick-stats.sh/install)
git-quick-stats
Quick & dirty: gitinspector
1,800 stars on GitHub. Developed in 2013. Written in Python
gitinspector makes our list because it is one of the easiest tools to install and use. After running it, you'll be provided with an output table similar to this example screenshot, which shows committers, how many LoC they changed, and how much of that LoC came via comments. According to GitClear's lines of code statistics, about 5-10% of lines are comprised of code comments, so this is a nice feature that other tools don't offer.
Install & try out:
npm i -g gitinspector
gitinspector --since=1-1-2020
More git stats free tool options
Additional git stats tools that didn't make the top three for either being antiquated, difficult to install, or lacking in visual reports.
- git-of-theseus. 1600 stars on GitHub. Developed in 2018. Screenshot example. Interesting because: It has a robust featureset comparable to Hercules and is simpler to setup.
- Git Hammer. 100 stars on GitHub. Developed in 2019. Screenshot example Interesting because: It's relatively new, and offers a wider variety of graphical reports than others.
- hoxu/gitstats. 1,100 stars on GitHub. Developed in 2009. Screenshot example. Interesting because: It's the grandfather of all git stat tools, and still a high ranking Google result.
- tomgi/git_stats. 900 stars on GitHub. Developed in 2012. No screenshots posted online. Interesting because: Obscurity affords an air of intrigue.
Wrap up
Each of the four sources of git stats has its benefits. For most people that simply want a quick & dirty assessment of the activity in their repo, we recommend the command line options. They are readily available, and even in large repos like Tensorflow, git shortlog can run complete within seconds.
If you are looking for git stats because you want to make decisions, we recommend GitClear. Simply put, it is the only product that has credibly taken on the audacious task of translating lines of code into a stable, signal-rich source of truth.