tl; dr Don't like reading? Here's a 2m video comparing Directory Browser to Github's version of the same.
Today marks the launch of a feature we've been looking forward to since our inception. For this one, we wanted to address a few of the most common customer questions we hear:
- How can we identify where tech debt is lurking in our code?
- What are the biggest changes to our repo during the last X months?
- Which developer is best suited to make an update to Y legacy feature?
The answers to these questions and more lie within the newly launched File Browser:

Image: Past six months of activity in the Bonanza repo
The easiest way to check out the benefits of the File Browser are to go try it yourself right now! If you're a customer, just visit the "Browse" tab in the context of a repo and you'll have this new lens into your data, voila!
While the File Browser has insights for technical managers and C-level employees, it's probably most valuable for developers themselves. Read on to learn more about how its features combine to deepen your relationship with your repo's data.
Most active contributors
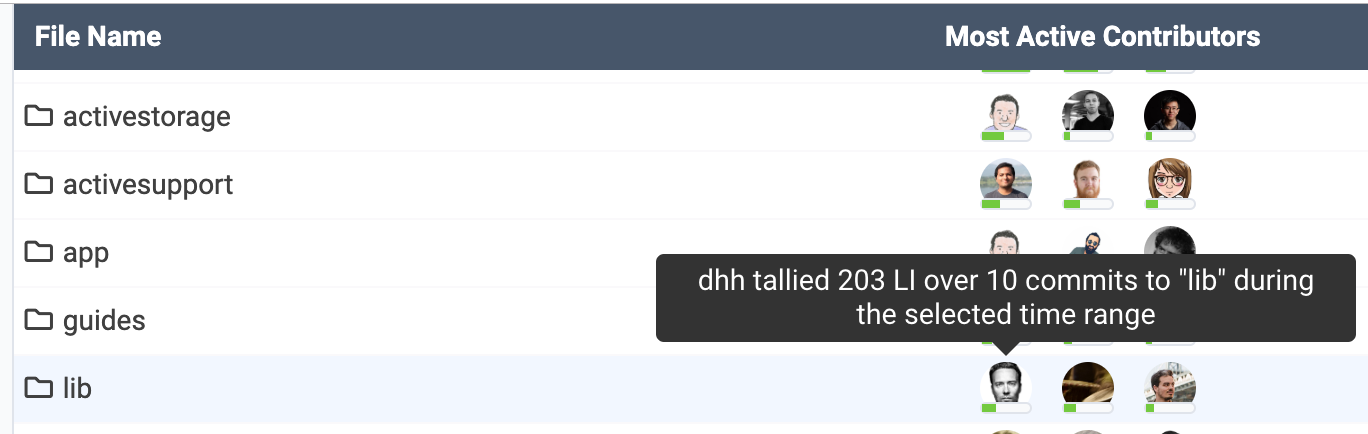
Image: Past six months of activity in the Ruby on Rails Github repo: "Most Active Contributors" column
For each directory or file in your project, we provide a list of which committers have made the biggest impact during your selected time range (up to one year can be viewed at once).
If you're a developer who has to maintain code in this directory, this is the fastest path to find who to send your inquiries toward. If you're a technical manager who knows the style of code written by your developers, this column foreshadows the style of code you'll find. If you're a C-level sort, this is the fastest way to acquaint yourself with which developers have been working on what areas within your software.
Line Impact

Image: Past six months of activity in the Ruby on Rails Github repo: "Line Impact" column
For each directory or file in your project, we'll show how much Line Impact has been accumulated over your selected time frame.
If you're a developer, this information is like gold when you're new to a project and trying to quickly grasp where da code at. Continuing the Rails example, where do you suppose most of the work has been invested during the past six months? If you guessed ActiveRecord using the screenshot above, congrats! But more specifically than ActiveRecord?

Image: Past six months of activity in the Ruby on Rails Github repo: "Line Impact" column
Aside from tests, the most work during the past six months has gone into connection_adapters and associations. Apparently Rails will be launching some juicy new features in those areas for Rails 6.1. Tip o the cap to user kamipo (#1 most active contributor) for making that happen.
If you're a manager or C-level user, this data gives you a lens into where your team is spending their energy. Are you maintaining a legacy module that feels like its soaking up time, but you're not sure how much? Instant answers. Same if you're wondering whether tests and documentation are being maintained. Or whatever other area you've hoped the team will focus on.
Impact Velocity

Image: Past year of activity in the Facebook React Github repo: "Impact Velocity" column.
At last we arrive at the killer feature: using live data to pinpoint tech debt.
The "Impact Velocity" column [0] measures how rapidly developers can make progress in a particular directory. Or, by inverse implication: when velocity is low, you are probably looking at some form of tech debt.
More specifically, directories with higher velocity are places where one of two things is happening:
- Developers are able to get work done quickly & efficiently, thanks to low tech debt and solid documentation 🎉
- Your Line Impact settings are (intentionally or unintentionally) partial toward a certain type of work 😯
The first phenomenon is pretty self-explanatory. Directories with high velocity typically indicate low tech debt, and low tech debt makes happy engineers.
The second case is a bit more interesting. You can see one good example in the Facebook React repo [2]:

Image: Past six months of activity in the Facebook React Github repo: note the top folders for Impact Velocity
The highest Impact Velocity values are react-noop-renderer (which appears to be a test server), and react-test-renderer, more tests. This occurs in many types of repos as a result of the fact that test code tends to breed numerous simple, short lines. As a manager, there is a philosophical choice to make. At Bonanza, we have a test-first, document-first mentality, so we intentionally let these areas accumulate Line Impact quickly compared to, say, HTML view code. We want to induce more of this behavior. But if you wanted Impact Velocity to be exclusively a measure of "mental energy invested," you could use your repo settings to tune the multiplier downward for test files.
I don't know if it's possible to overstate how cool it is to us to see tech debt visualized from live data! To our knowledge, nothing of this sort has been accomplished before. Which makes sense, since it is Very Difficult to quantify how much impact is being made across arbitrary code files, and it is also Very Difficult to quantify how much time is being spent per commit (thus still more difficult to quantify how time is being spent per file per commit [3]). We have spent the better part of 4 years building out the infrastructure to solve these problems, and it is so satisfying to see all the work paying off in a real, actionable way like Impact Velocity.
File Selected

Image: Past six months of activity in the ReactFiberHooks.js file within the Facebook React Github repo
But we're not (quite) done yet..! When you browse down to the individual files, we have one final click for the developers: a specific rundown of who has been making the biggest commits within the file lately. When you want to chat about matters related to that file, these are your people.
The real use for this feature will become still more apparent in another blog post or two -- stay tuned 😉
Conclusion
By leveraging our single, reliable metric (Line Impact) to normalize code across file types, File Browser opens the door to new possibilities. This is the fastest way we know to exist for discovering the "how" and "where" of code being contributed across your repos. We're excited to hear how you use it!
Footnotes
[0] For every file and directory in which 60 or more minutes have been accumulated [1], we calculate the quotient of Line Impact / Fractional Hours Spent. We run this same calculation to derive your average Impact Velocity (aka "Line Impact per hour") across the entire repo. Then we compare it to the Impact Velocity of a particular file or directory.
[1] For directories that have accumulated less than 60 minutes worth of time, we don't show velocity. For more about how we calculate the "time used" part of velocity, see footnote 3
[2] Kind of makes you wonder where we're getting all these interesting screenshots of popular open source repos, hm? 🤔
[3] We currently use four different methods to approximate how much time was used per commit. The most basic of these is to evaluate the difference in time between subsequent commits. Once we know which commits took how much time, we divide those proportionally by the degree of change present in said file
Comments
No comments have been left on this blog.
Login to leave a comment