9 best software engineering KPIs, and how they get cheated

When people talk about engineering KPIs, there are two contradicting truisms one often hears:
What's measured improves.
-Peter Drucker
And
When a measure becomes a target, it ceases to be a good measure.
-Goodhart's Law
Both of these statements describe engineering KPIs in part, but taken together, they imply that it's impossible to use measurement to improve. How can a data-seeking manager reconcile this paradox?
The bad news is that it takes some commitment to learning, especially for those coming from distant (i.e., non-technical) roles. The good news is that, as of 2026, there are a growing number of well-researched engineering KPIs that can and do offer engineering insights in spite of "becoming a target."
In fact, if you use the metrics we recommend among Leading Metrics and Google DORA Metrics, the more employees try to "game the system," the more the business' long-term interests are served. We'll present examples to prove this as we review each metric below.
Requirements to qualify for the "best engineering KPIs" list
Before writing this article, we analyzed the metrics proposed by the top 20 Google results in the domain of "engineering KPIs". The most common weakness of these articles was the scarcity of actionable instructions that could be followed to gain access to the metrics within one's own engineering team.
For example, almost every Google result recommends measuring "Team Velocity." But no article will specify what units "Team Velocity" should be measured in. Is it... tickets closed? Lines of code? Story points? The wisdom of relying on an ambiguous metric like "Team Velocity" depends entirely on the units underlying the measurement.
We hope to avoid these legacy articles' errors of omission, so each metric recommended among our "Best metrics," "Google DORA metrics," and "Other good metrics" will include the specific steps to follow in order to quickly get access to these metrics on your own dev team (free of charge, when available).
Specific requirements to qualify for recommendation by this article
- Business value. Is it possible to draw a straight line from metric => business value created?
- Measurable. Can we define a specific number and its units of measure (e.g., points, percentage), so that it can be tracked over time and correlated with events and experiments?
- Actionable. Can it regularly inform action that leads to positive results? Preferably with minimal false positives?
- Available/convenient. Can an average software engineering team get access to this metric without changing their existing development processes?
- Popular/empirically proven. Does it have enough of a following to be well-documented and credible?
Of course, even if a metric fulfills all five of these requirements, it might still be easy for developers to game. That's why, as we review each metric below, we'll offer specific ideas on how to identify when team members might be chasing improved measurables at the expense of project health.
Full List of Metrics
Here is the full list of engineering KPIs that qualify under the stated criteria, circa 2025:
Here are these same metrics, along with a few others, cataloged & sorted by their salient attributes:
|
Metric
Seeks to quantify
|
Proven correlation with business success | Quick to set up & measure | Stable | Gaming-resistant | Limitations well-documented | Widely used to signal progress | Consistently defined | Total |
|---|---|---|---|---|---|---|---|---|
|
Business goal
|
Calculating | |||||||
|
Issue completion rate
|
Calculating | |||||||
|
Repo evolution rate
|
Calcuating | |||||||
|
Refactoring candidates
|
Calculating | |||||||
|
Issue completion rate
|
Calculating | |||||||
|
Developer effort
|
Calculating | |||||||
|
Product planning efficacy
|
Calculating | |||||||
|
Issue completion rate
|
Calculating | |||||||
|
Critical defect avoidance
|
Calculating | |||||||
|
Critical defect avoidance
|
Calculating | |||||||
|
N/A (git artifact)
|
Calculating | |||||||
|
Delivery responsiveness
|
Calculating | |||||||
|
Tech debt risk
|
Calculating | |||||||
|
N/A (git artifact)
|
Calculating | |||||||
|
N/A (contains multitudes)
|
Calculating |
🎯 Leading engineering KPIs (non-Google)
Following are the few engineering KPIs that land in the sweet spot between "empirically validated," "widely used," and "gaming-resistant when correctly applied." Generally speaking, the harder a developer works to optimize for these metrics, the better the businesses' long-term prospects become.
OKR-driven

Most famously used by John Doerr to help Google Founders Brin & Page create transparent goals to be shared & measured by every Googler. Eric Schmidt summarized the influence of OKRs on Google succinctly: "they changed the course of the company forever." [1]
The greatest benefit of OKR-driven metrics, especially when periodically updated, is that they are hand-crafted to optimize for business value. The drawbacks are that OKRs can be time-consuming to create/negotiate, and the success of the Key Result will often be controlled in part by factors beyond the Developers' direct control (e.g., Sundar Pichai's 2018 Key Result that "Google Chrome reaches 20 million seven-day active users")
How to game it? OKR targets are chosen to accord with known business objectives, which makes these generally the least "gameable" of any software metric. For example, if a VP suggests that a Senior Developer should set an OKR of "drive 50% more profit to the product than last quarter," so long as that measurement can be reliably tracked, it's effectively game-proof.
There is risk that, in the process of picking Key Results, the parties may inadvertently choose inherently gameable metrics. For example, setting a Key Result to "introduce less than 10 bugs per month" could be pursued by launching no new features. Still, assuming both parties chose their targets carefully, and are acting in good faith, this metric is a gold standard for many successful businesses.
How to get it? Depends on the particulars of your use case. Three good options:
- Via existing measurement dashboards specific to your company, or online services that help create OKRs like WeekDone.
- Reading Measure What Matters to understand the spark that created this measurement, and the principles of implementing your own OKR system
- Email GitClear to let us connect you with vetted OKR experts who have helped other large companies navigate the OKR creation process.
Story Points Completed
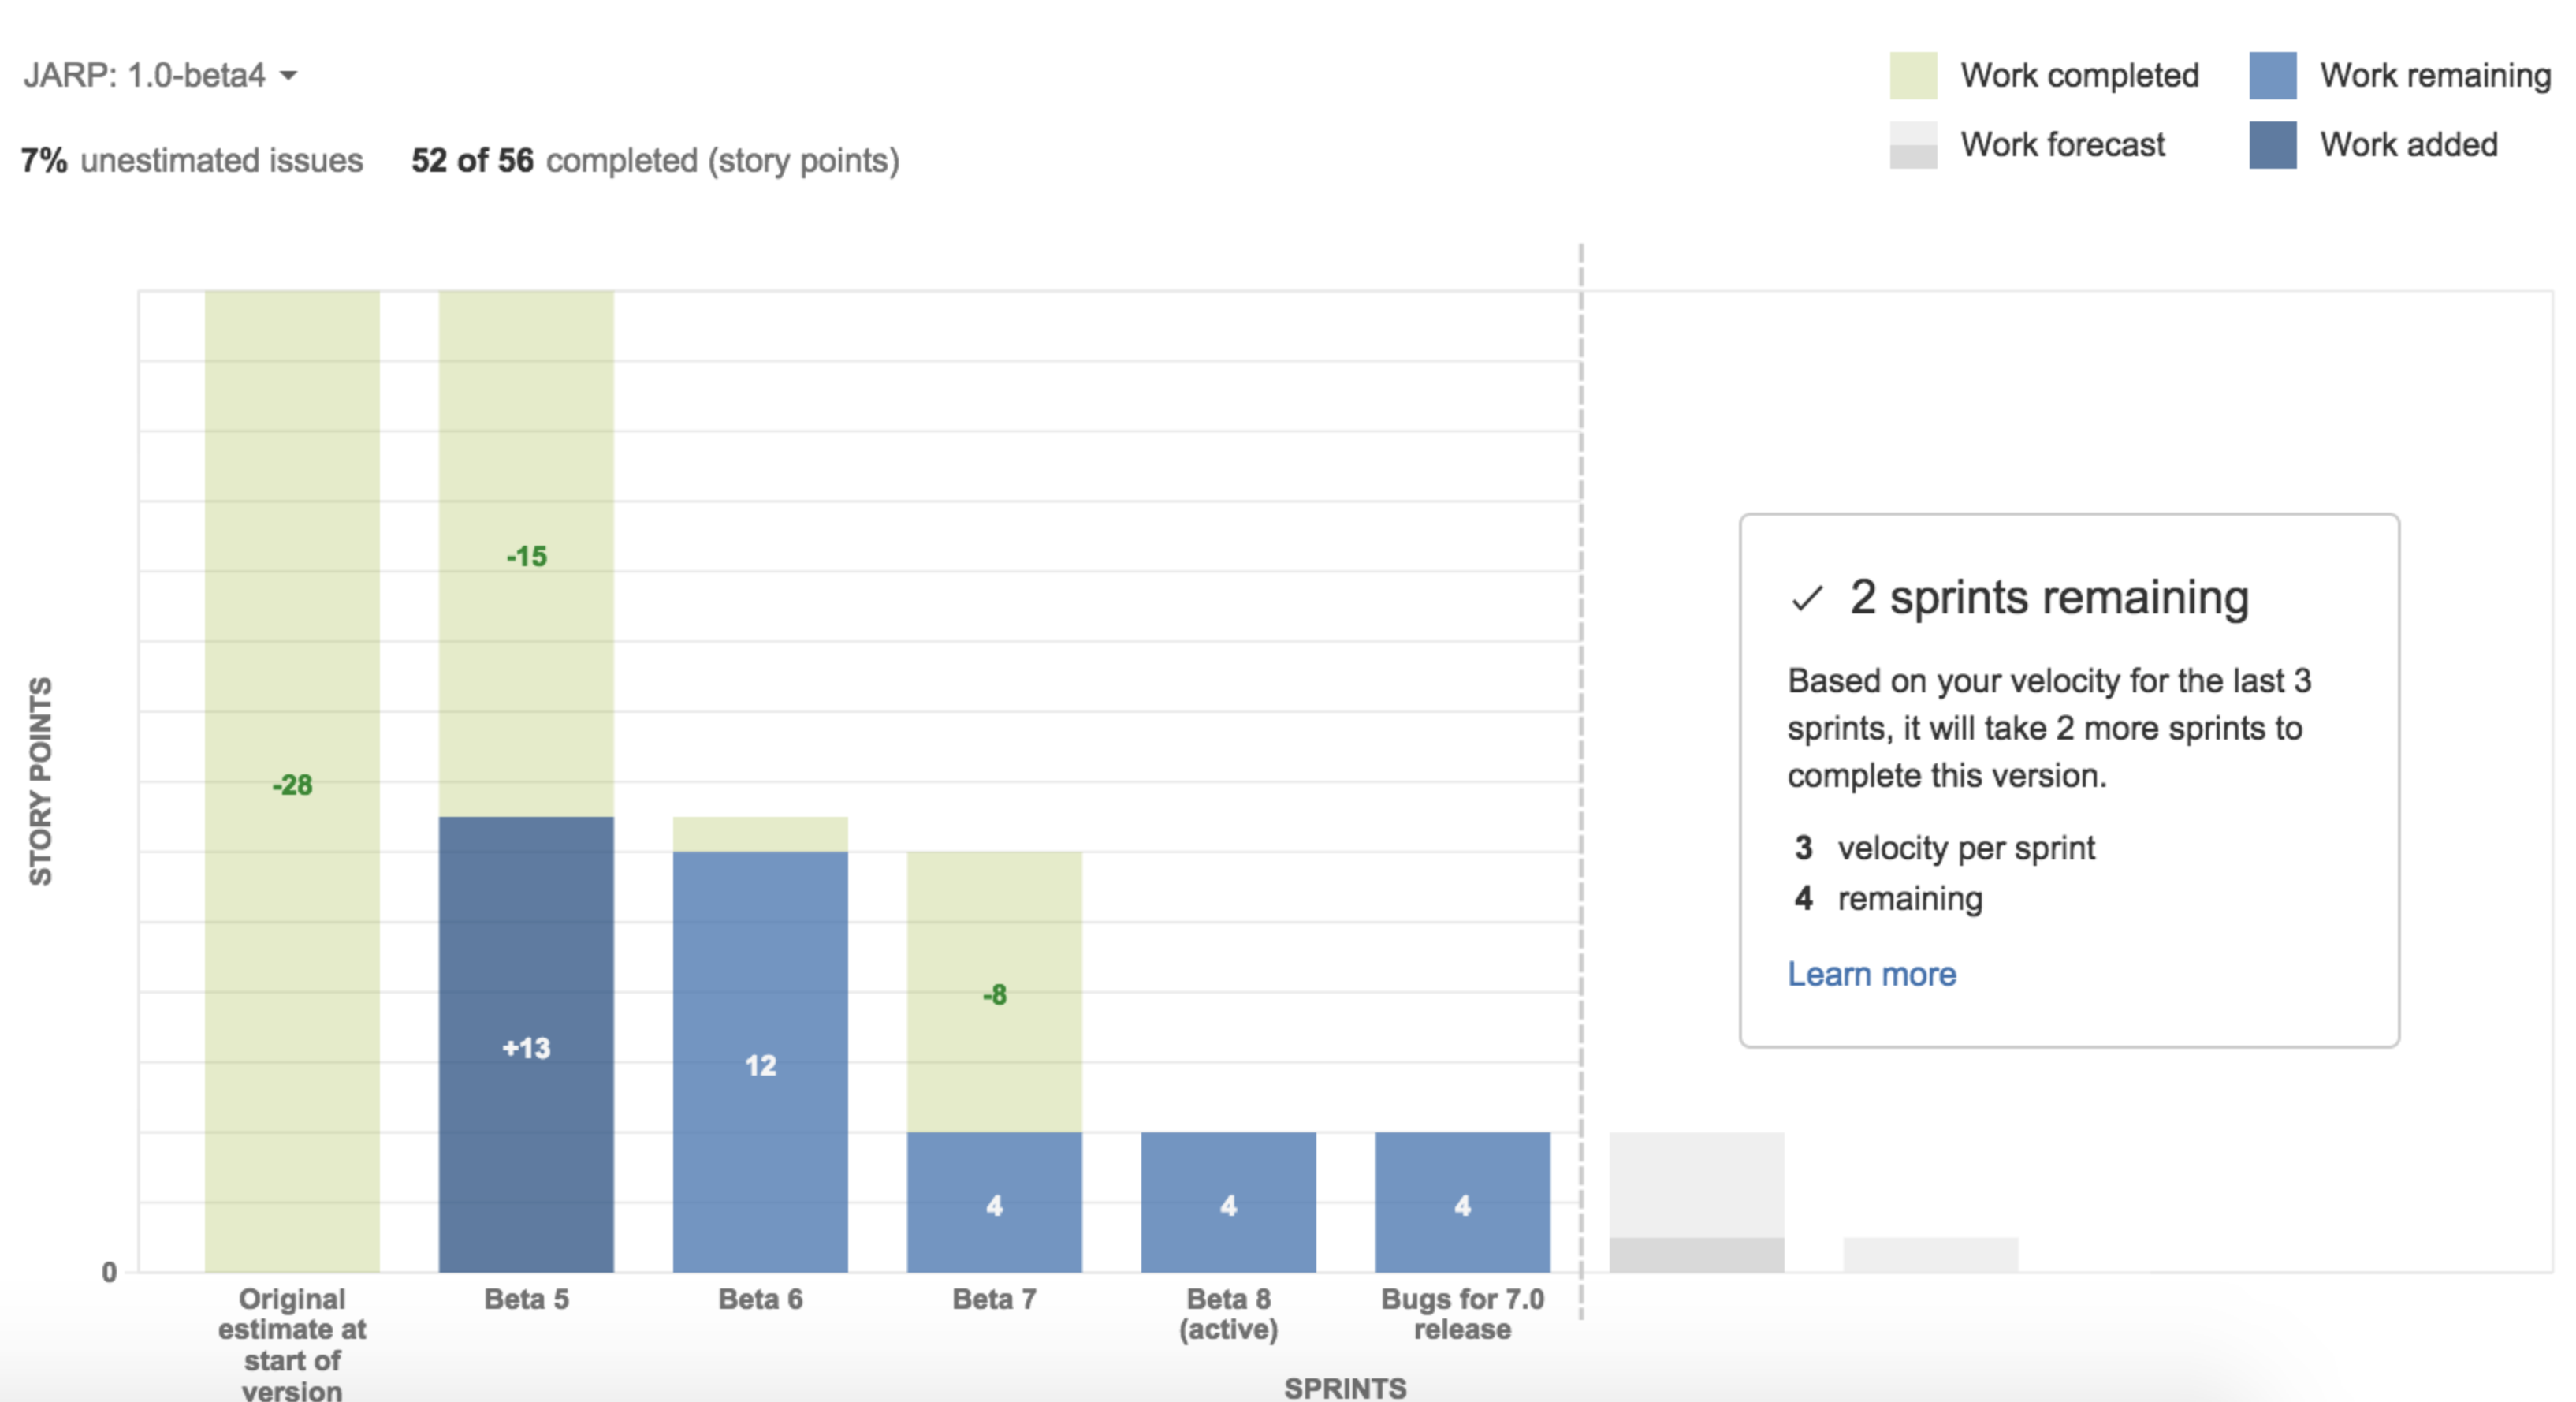
Story Points could lay claim to be the most "classic" of engineering KPIs. There are many different ways to calculate Story Points. Whatever method you use to estimate it, Story Points map back to a blend of "expected developer time" and "expected effort" to complete some task.
Managers can use Story Points to calculate the costs implied by a task in order to make informed decisions in prioritizing their Jira queue. For example, if a developer earns $10k/month, and a ticket is estimated at 10 Story Points (half of month of weekdays), that implies a cost around $10,000 * 0.5 = $5,000. Using some version of that calculation helps prioritize tasks based on which yield the highest ratio of Projected Value / Projected Implementation Cost.
How to game it? A few strategies must be applied to mitigate Story Point estimation gaming:
- Use planning poker to create time estimates. Applies wisdom of the crowd to extract an effort-based estimation minimally tainted by politics.
- Allow developers to choose their own tickets in a "task marketplace." If the developers on a team get to self-assign tickets (e.g., in round robin fashion at the beginning of a sprint), this allows all developers comparable access to select whatever mis-estimated tickets may occur and distribute them equally.
- Don't use across teams. Since every team's exact definition of Story Points differs (subtly or otherwise), comparing Story Points values from team-to-team doesn't make sense.
How to get it? Most any issue tracker this side of GitHub allows specifying Story Points. In terms of viewing them, Jira provides a "next-gen velocity report" dedicated to the purpose of showing Story Points completed over time. GitClear also offers historical tracking of Story Points including calculation of the correlation between Diff Delta and Story Points, which can help improve future estimation efforts during sprint retrospective. This feature is available on GitClear's free (Starter) pricing plan. Jira also offers a free version for teams of 10 or fewer.
Δ Diff Delta

Diff Delta is a software metric designed to measure the extent to which a set of commits evolves its repo. This video offers an over-simplified three-minute explanation. The gist is that Diff Delta cancels out all of the work-in-progress activity ("churn") that happens as a feature gets developed, leaving a concentrated embodiment of how much a set of commits evolved the repo from its starting point. Diff Delta is conserved across languages, so it takes a consistent amount of time to generate Diff Delta whether the developer is writing Java, Python, Javascript, or any other major programming language (30+ supported).
In terms of business value, both Diff Delta and Story Points (which tend to converge among teams with reliable effort estimation) approximate how much productive effort is being spent by developers toward advancing the project. The biggest difference between "Story Points complete" and "Diff Delta" is that the former captures strictly work done to resolve issue tracker tickets that were assigned, whereas Diff Delta captures work on tickets AND work done to pay down tech debt (by updating or removing legacy code). In teams that measure their progress with Diff Delta, Senior Developers have strong incentive to freshen legacy code systems alongside the Jira ticket work they've been assigned.
Because real-world software teams almost never create Jira tickets specifically to reduce their code footprint or modernize legacy systems, Diff Delta is an effective means to ensure that long-term code health gets attention of the team, alongside the day-to-day work of implementing new tickets.
How to game it? Simply put, Diff Delta was designed to be gamed. <-- That help page explains how Diff Delta rewards developers when they implement new work that integrates with existing systems. In other words, if the developer upgrades legacy code while integrating new features, their Diff Delta will tend to outpace their teammates focused on adding more and more new code (which slowly erodes the rate at which a repo can evolve). Diff Delta also creates incentive to avoid copy/pasted code, write & update tests+documentation more often, and delete or update code that has lingered for 12+ months.
The tendency of Diff Delta to shadow "Story Points completed," with an emphasis on overall repo health (e.g., more tests, more documentation, more reuse) makes it a perfect companion to teams that are already measuring progress via Story Points. The more that a developer tries to "game" Diff Delta, the healthier their code trends.
No, really, how to game it? Diff Delta is engineered to measure the rate at which a repo evolves, especially if that evolution involves the removal of old code. So, if a developer were to delete a bunch of methods from a legacy library, they would appear to be generating high Diff Delta, even if that wasn't the task they had been assigned.
How to get it? As of GitClear's v4 release in November 2021, access to Diff Delta is permanently free for developers on the Starter plan. Prices start at $14.95 per active developer for commercial use (for convenience, see a detailed comparison of pricing vs other Developer Analytics here). GitClear also offers an On-premises (locally hosted) version of the product for teams that need SOC2-level security administered within their own firewall.
Change coupling
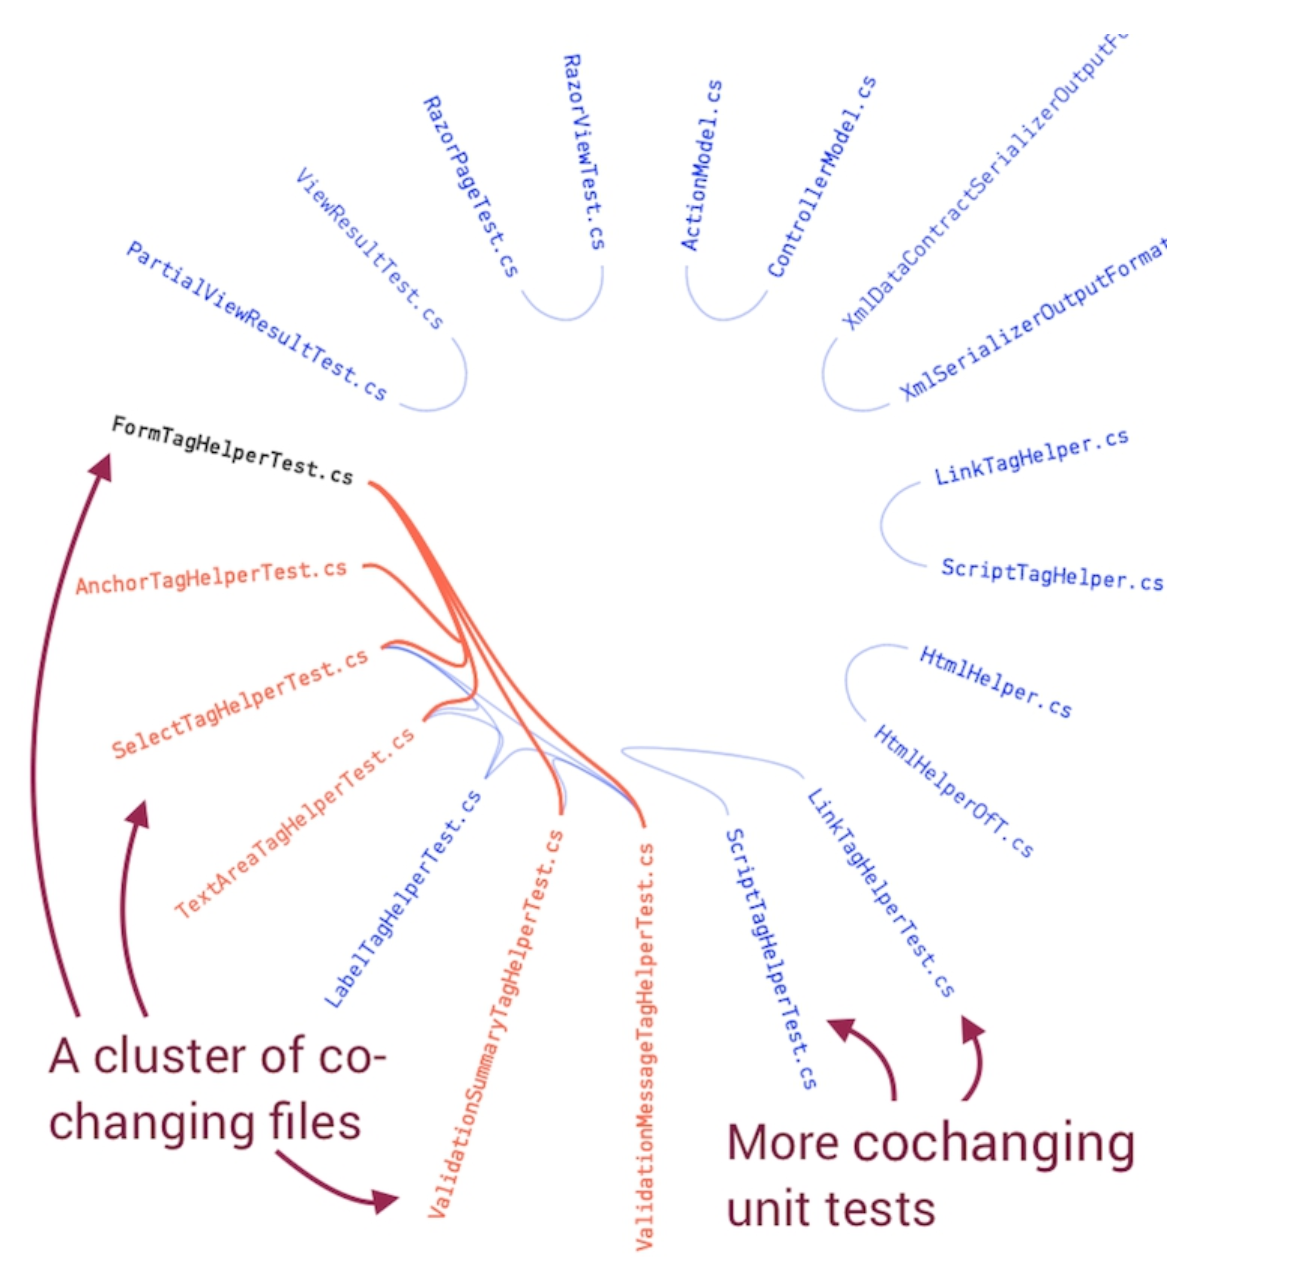
Change coupling is a metric designed to show when files co-evolve in the same commits together. It is a proven means to detect locations with high tech debt in a given repo. According to Software Design X-Rays author Adam Tornhill,
My favorite heuristic is concept of surprise... Surprise is one of the most expensive things you can put in software architecture. Not only is it expensive to maintain [coupled changes], but it also puts us at risk of forgetting to update one of the files, with potentially severe consequences.
We recommend reading more about change coupling in chapter 3 of Software Design X-Rays to learn more about the ways change coupling can be used. The business value of avoiding change coupling is that it leads to lower tech debt, and in turn, a lower rate of critical defects.
How to game it? This is not a metric that developers accumulate, but rather a metric that a team seeks to avoid. As such, the concept of gaming does not apply to this metric in any conventional manner. That said, if a developer was bent on avoiding the stigma of coupled changes, they could hypothetically split their commit such that it would appear that the files were being changed independently. We have heard no reports of such behavior.
How to get it? The first software metrics provider known to offer change coupling was Codescene, which is where the origin of the screenshot above. GitClear also offers the change coupling metric on a per-file basis through its Tech Debt Browser.
 Google DORA Devops Metrics
Google DORA (short for "DevOps and Research and Assessment") are a set of metrics that Google has been benchmarking with real teams since 2018. This makes Google DORA stats perfect for managers who would like to get a sense for their teams' DevOps performance looks relative to other dev teams:

As of 2025, each of Google's four recommended metrics (reviewed individually below) offer a target for teams that aim to be "Elite." We will call out those target thresholds along with reviewing the use case and applicability of each metric.
Lead Time (Deploy Cycle Time)
Google defines "Lead Time for Changes" as
How long does it take to go from "code committed" to "code successfully running in production?"
This definition of Lead Time seeks to create incentive for a team to deploy their code frequently. In "Elite" teams, where Lead Time averages less than one hour, as soon as a commit is made to the trunk branch, it begins its journey down the road toward being tested and deployed.
For a team to qualify as "Elite," it almost certainly will need to have implemented Continuous Integration ("CI") and Continuous Deployment ("CD") processes. These DevOps methods have soared in popularity since the mid-2010s, because they automate away the busywork that has traditionally been required to release new code (e.g., QA signoff, manually build and upload assets). "Elite" status also implies that the deploy process must be able to complete in less than an hour, which is clearly preferable to the alternative.
How to game it? As mentioned above, setting up CI and CD are key to "gaming" this metric, since they negate the testing and deploy steps that leech time from low-performing teams. But that tactic isn't actually "gaming" in the sense that it produces an undesirable outcome in pursuit of over-optimization. Rather, when a team has a low Lead Time, it is an authentic, effective reflection that a team has successfully cultivated habits that rapidly allow moving code from "pushed" to "tested" to "available to customers." 🚀
The question that an engineering leader may struggle to decide is whether the costs of setting up and maintaining a Continuous Deployment process outweighs the drawbacks? Some teams determine they don't want their average Lead Time less than an hour, for example if they want nominal human vetting of new builds, or if they want to leave the option of developers making work-in-progress commits to the main branch.
How to get it? All four of the most popular Developer Analytics companies (GitClear, Pluralsight, Code Climate Velocity, LinearB) implement some version of Lead Time calculation, as does Jira. The challenge in getting these stats is that there are two similar-but-distinct interpretations of "Cycle Time." One is "Deploy Cycle Time," described in this section. The other is its cousin, "Pull Request Cycle Time," which is described separately below. Each stat can provide value, depending on what aspect of the development life cycle the manager is seeking to optimize.
Time to Restore Service (also known as "Mean Time To Repair" or "MTTR")

Google defines "Time to Restore Service" as
How long does it take to restore service when a service incident or defect that impacts users occurs (e.g., unplanned outage, or service impairment)?
Elite teams are able to respond to critical defects within one hour, whereas "Low" teams are measured to take "More than six months" (yikes). That is to say, there is a huge amount of variation in benchmarked values of this metric, given the intrinsic differences of different release environments. That is, fixing a critical defect in the App Store generally can't happen in less than 24 hours given Apple's turnaround time to review updates.
How to game it? This metric does not lend itself to being gamed. However, when one hopes to observe how their team's performance on this metric is changing over time, they're likely to discover extremely high variance in MTTR from incident-to-incident. In fact, this is likely the "noisiest" engineering KPIs among all those listed, because the "time to repair an issue" is impacted by everything from "did the defect occur at the beginning of a weekend?" to "did the defect repair get deprioritized because support found a way to triage the problem?" Google's own benchmark values for this metric, ranging from "under an hour" to "more than six months" speaks to how extreme noise diminishes the utility of this metric as a tool for day-to-day decision making.
How to get it? Time to Restore Service is offered as part of GitClear's DORA stats, as well as being offered by LinearB. There is no evidence that this stat has been implemented by Code Climate or Pluralsight Flow as yet.
🐞 Change Failure Rate, aka "Defect Percent," "Bug Rate," "Critical Defect Frequency"

Historically, there have been numerous methods proposed to capture the rate at which important bugs are being released. With this metric having been formally enshrined among the DORA stats, we now have a single, concise definition to unify teams:
What percentage of changes to production or released to users result in degraded service? (e.g., lead to service impairment or service outage) and subsequently require remediation (e.g., require a hotfix, rollback, fix forward, patch)
According to the the benchmarks, 0-15% of the releases made to an Elite team's product will result in the type of degraded service Google describes. Since this metric is the ratio of "critical defects" to "releases", it is necessary to measure both of these in order to calculate Change Failure Rate. An example implementation to capture both metrics is described in GitClear's DORA documentation.
How to game it? This metric is not regularly gamed in production environments we have observed. However, one possible path by which a team could try to shape this metric to look artificially better for them: manipulate the process that designates defects as "critical." If the team itself is responsible for demarcating when a critical defect has occurred or a "service impairment" has occurred, they can make that bar so impossibly high that it will never be triggered (think AWS health dashboards, which almost never change in response to user-observed outages).
How to get it? GitClear and LinearB both offer this stat as part of their respective Google DORA integrations, and the open source Four Keys project also offers a visualization of this metric.
Release Frequency

The most redundant and easily gamed among the Google DORA metrics, Release Frequency is described in their docs as:
How often does your organization deploy code to production or release it to end users?
In the context of software that ships, or otherwise has a days- or weeks-long process that must be traveled until it is delivered to customers, then this metric can provide useful signal to the team as they see the metric fluctuate over time.
⚠️ How to game it? For the typical web app, this metric is highly gameable. It's not difficult to set up a Continuous Deployment environment where every single commit counts as a "release." Such a team might have orders have magnitude higher values of "Release Frequency" than another team in the company that released "only" once per day. Absent service interruptions (already measured by MTTR), it's difficult to imagine substantive benefits to shipping more than once or twice per day per team.
How to get it? GitClear and LinearB both offer this stat as part of their respective Google DORA integrations. This stat can also be derived via the Four Keys open source project
💁 Workable engineering KPIs
Beneath the leading metrics are a second-tier of engineering KPIs that require more caution before using their data to make decisions. These metrics can still provide usable signal for a seasoned Engineering Manager. We'll dig in with the nuance required to extract the best from these metrics in the context of their limitations.
Pull Request Cycle Time

Not to be confused with "Deploy Cycle Time," this metric is meant to measure the weekday hours that transpire between the first commit on a particular issue, through to the time when that issue (Jira) has its pull request merged.
This metric optimizes for teams that would like to speed up the time between when a ticket is started and when it has been reviewed and approved by all developers. Managers often think about PR Cycle Time as a proxy for "How long are developers taking to implement Jira tickets?" This is a good starting point for conceptualizing the metric, but there are two other major factors that are muddled together in the PR Cycle Time metric: 1) Are the instructions for the Jira unambiguous, and did they consider edge cases? 2) Was the developer able to get their PR reviewed and approved in a timely fashion?
Before penalizing a team or developer for a low PR Cycle Time value, it is advisable to first inquire about the quality of the instructions in the tickets that developer is working on. If the design for a ticket is vague or incomplete, a higher PR Cycle Time inevitably follows.
How to game it? It's possible to create an artificially low PR Cycle Time by minimizing the duration between a developer's first commit on an issue, and the time the PR is closed. Since the starting point for this metric is defined by a commit, it is susceptible to the usual tricks that can manipulate commit count and commit authorship time. For example, a developer could repeatedly amend their first commit before pushing it, or after their initial push, they could later force-push their PR branch such that the time of first commit authorship is immediately before the pull request is submitted.
How to get it? All of the major Developer Analytics platforms offer some version of this report. Before using it to make decisions, be sure you have verified whether the metric is in fact Deploy Cycle Time or PR Cycle Time -- the remedy to reduce each interval will vary, and companies are often not transparent about which version of Cycle Time is being presented.
Pull Request Completion Rate
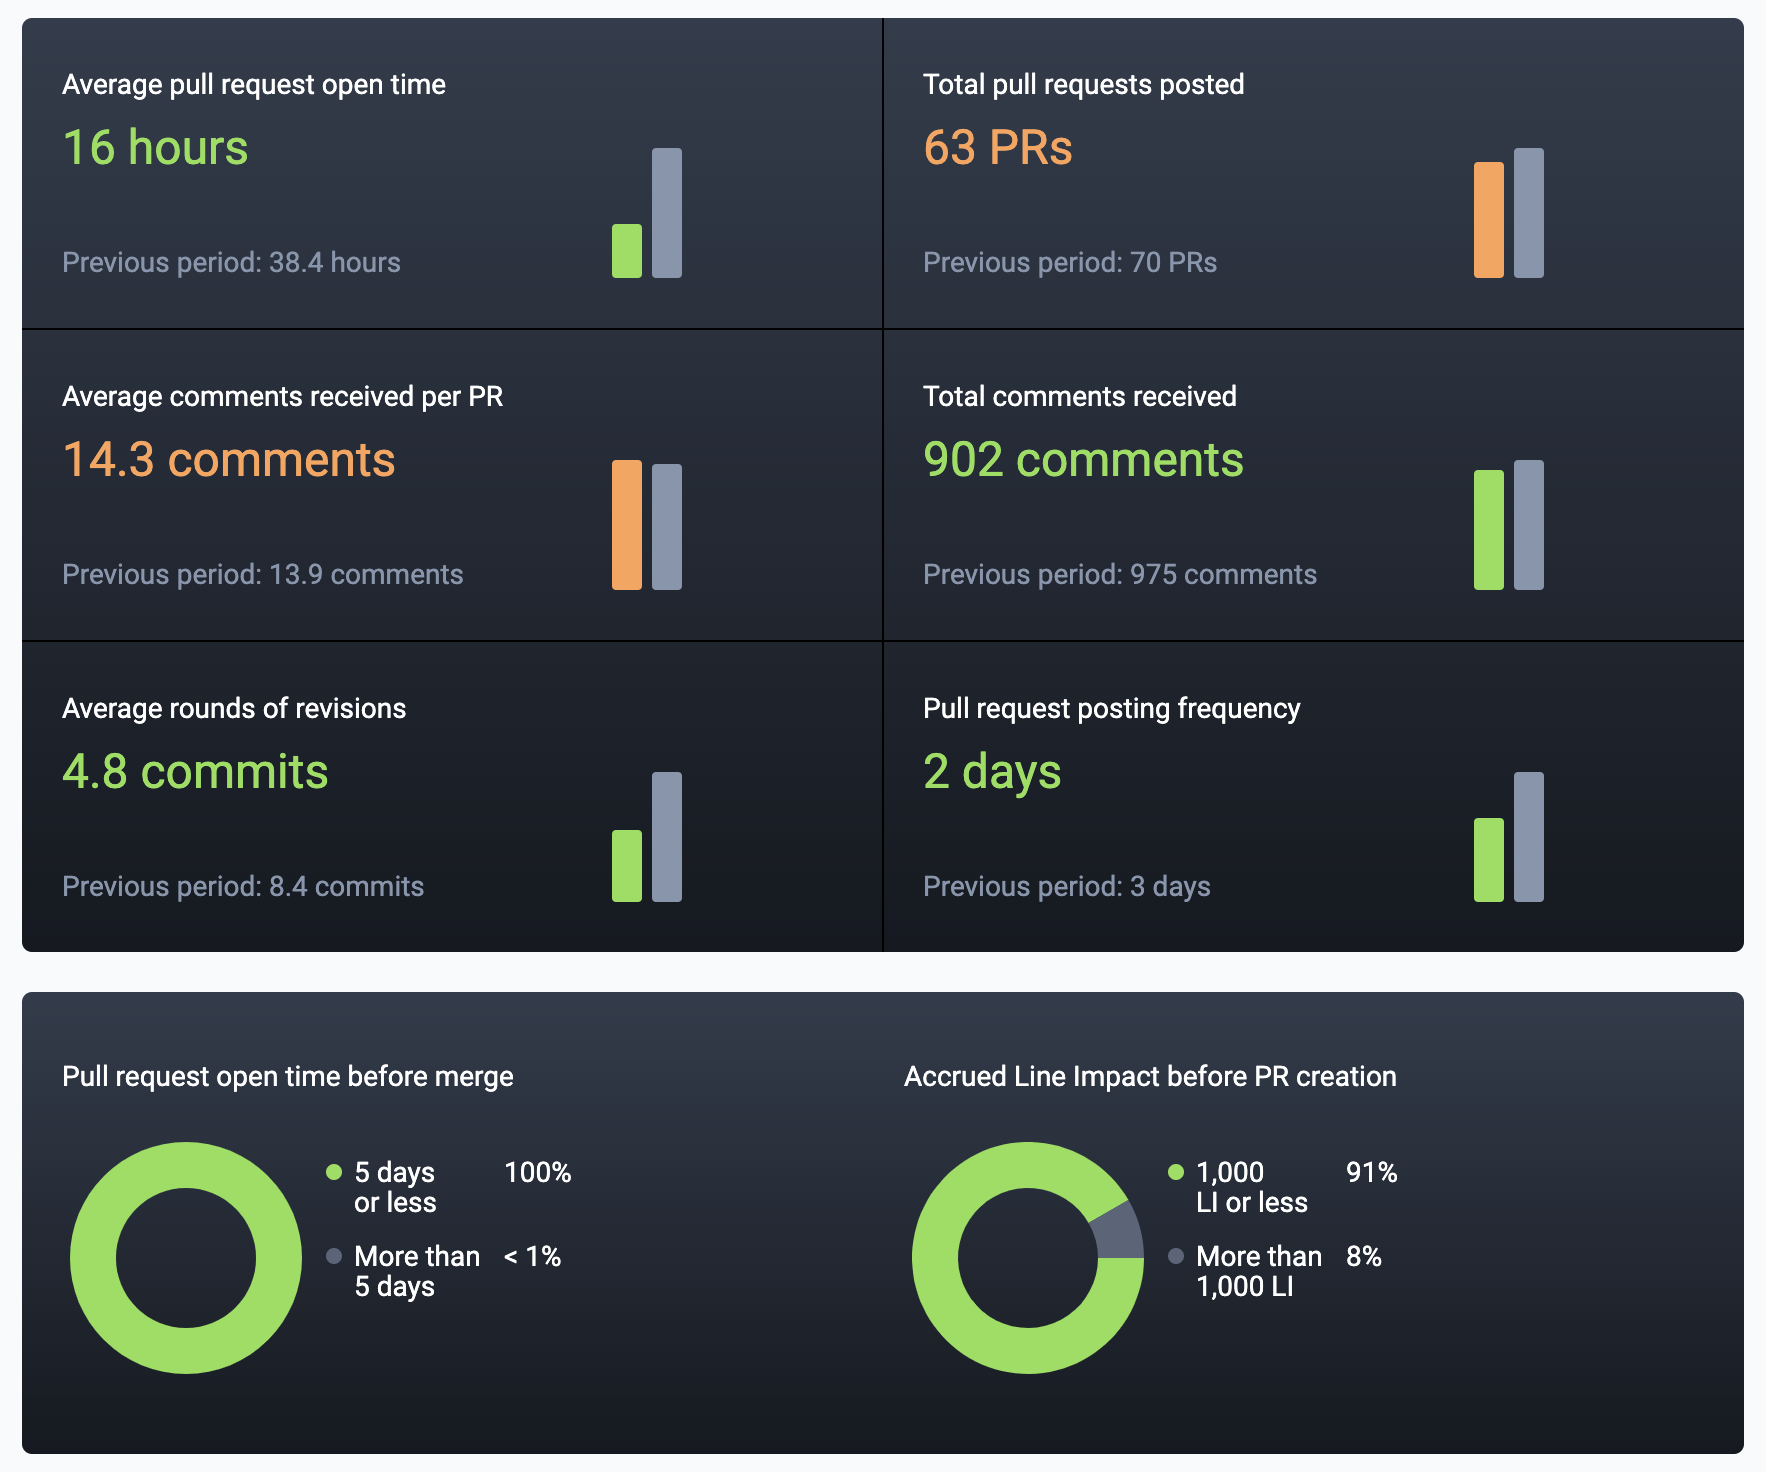
What percentage of pull requests were closed within a week of being opened? This rolls up several more granular questions, like "is the team engaged in responding promptly to new pull requests," "are they able to cooperate," and "have the developers polished their code before submitting it for merge?"
How to game it? Acing the "Pull request completion rate" test means always closing PRs within a week. This is relatively hard to game, but it must be counterbalanced by a propulsive force such as Story Points or Diff Delta, otherwise all of the team's incentives will be to polish work rather than ship it (or submit it for PR review).
How to get it? All of the "name brand" Engineering Insight providers (GitClear, Pluralsight, Code Climate, Pinpoint) offer stats that illustrate the efficiency of a team's pull request process. We help compare the providers here.
Test Coverage Percent
Having broad test coverage is key to long-term code health, and on that basis, it makes a lot of sense to try to measure Test Coverage. However, the path to measure it is fraught with complexity, as test coverage is measured on a per-language basis, based on heuristics that can be difficult to assess.
There are also a few fundamental challenges to the utility of measuring code coverage. Adequate testing must include functional and integration tests alongside unit tests, and no automated solution can know which pages need to be visited within the app or website, this still takes human direction It's also difficult to tie back this measure to top-line business metrics. A related but more business-functional metric to track code defects is Google's "Change Failure Rate."
Home to game it? There is no general recipe for gaming test coverage, since the measure depends entirely on how it is implemented.
How to get it? CodeCov has a thorough list of code coverage tools available on varying platforms.
⚔️ Other engineering KPIs
The list above is relatively short compared to corpus of past metrics that have been proposed by other authors. For the sake of completeness, let's review some of the most commonly mentioned metrics elsewhere, and why they didn't make the cut.
Commit Count

GitClear has spent no shortage of words chronicling the shortcomings of "Commit Count" as a benchmark stat to rely upon. This metric is prone to bursts of irrelevant noise (subrepo commits, deployment/cache assets, potentially rebase), and it affords the same weight to a single-character change, or a change that substantively modifies every file in the repo. That's the bad news.
That said, by zooming out to a years-long view, and taking aggregate data of developers who (except in rare, team-specific circumstances) did not work under the belief that they were being judged by their commit count, these shortcomings get smoothed over, leaving a relatively signal-rich data measurement that correlates with Story Points completed up to 0.5 for teams with strong software estimation skills.
⚠️ How to game it? Commit Count is right up alongside "release count" or "lines of code" as the most trivial metrics to manipulate. If developers know that this measurement is being used to judge them, bad tidings are sure to ensue. However, if the metric is analyzed retrospectively, it can be used to establish an expected range of outcomes for new hires.
How to get it? How not to get it? Every git provider and every stat provider will offer you the ability to view Commit Count. It is the easiest of all git metrics to derive.
Team Velocity
This was one of the most popular metrics cited by other articles. It's recommended by TechBeacon, InfoPulse, and SeaLights.io. However, authors seem wary to define the units of this important metric. TechBeacon defines it as "how many 'units' of software the team typically completes in an iteration." Not so tangible. InfoPulse doesn't try specifying units. SeaLights says the units are "Story Points." Thus, we conclude that the notion of "velocity" is adequately captured by Story Points, or Diff Delta by proxy.
🚧️ Deprecated engineering KPIs
Nothing to see here, move along.
Code Churn
The CEO of GitPrime (now acquired by Pluralsight) was among those who advocated for considering Code Churn. We argue in response that the implications of Code Churn are all over the map, which renders it very difficult to act on high churn. Metrics need to be actionable.
Lines of Code
If you're a developer, you don't need this article to explain to you why "lines of code changed" are the worst possible metric to use, relative to modern options. If you're a Manager or if you haven't read about developments in engineering KPIs over the past 10 years, this funnel visually illustrates how only 4% of Lines of Code contribute value. This is why Lines of Code scored lowest of all metrics in empirical research on how metrics correlate with software effort.
Any engineering KPIs that has served you well that we failed to cover?
We are also always eager to get feedback via . Let us know what you think, especially if there are other engineering topics where you'd like to see a deep-dive analysis like the above!
Footnotes
A few additional resources to learn more.
[1] When John Doerr Brought a ‘Gift’ to Google’s Founders. Also Google use OKRs